


Page 21 - August-September-2018
P. 21
20                                                                                                             21
 Pakistan Free Trade Agreement   10pc decline in global cotton


 with Thailand and Indonesia  stocks projected in 2018-19


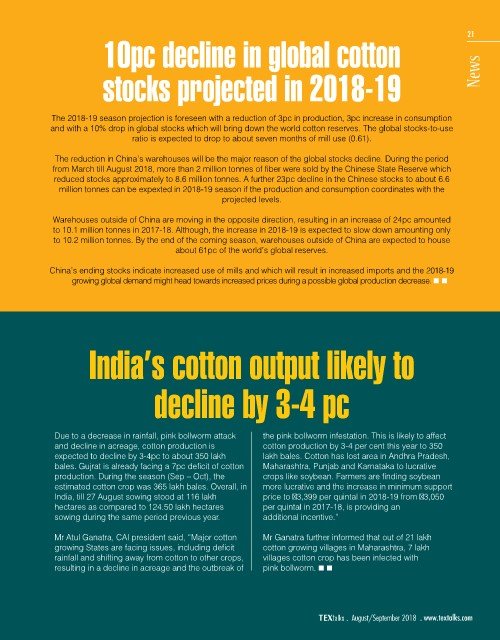
 Pakistan would evaluate trade policy according to   start in mid of September 2018 to increase trade   The 2018-19 season projection is foreseen with a reduction of 3pc in production, 3pc increase in consumption
 modern trends and Strategic policy framework   liberalization between the two countries. The list   and with a 10% drop in global stocks which will bring down the world cotton reserves. The global stocks-to-use
 2015-19 would also be implemented in letter and   includes textile and automobile sector. Pakistan   ratio is expected to drop to about seven months of mill use (0.61).
 spirit to boost the country’s exports.  wants concession on a total of 110 textile products,
 plastics, agriculture products and pharmaceuticals.  The reduction in China’s warehouses will be the major reason of the global stocks decline. During the period
 A commerce ministry official Pakistan has made a   from March till August 2018, more than 2 million tonnes of fiber were sold by the Chinese State Reserve which
 commitment to search for new trade avenues   Currently, the annual bilateral trade volume of   reduced stocks approximately to 8.6 million tonnes. A further 23pc decline in the Chinese stocks to about 6.6
 including Africa, South America and South East Asia.  Pakistan and Indonesia is worth $180 million. Both   million tonnes can be expexted in 2018-19 season if the production and consumption coordinates with the
 the countries for the bilateral preferential trade   projected levels.
 FTA with several countries including Thailand, Turkey   agreement have finalized a review process that will
 and China are under negotiation. In the Pak-China   enhance the local exports to South East Asian   Warehouses outside of China are moving in the opposite direction, resulting in an increase of 24pc amounted
 second phase, China agrees to provide the market   country by $210 million each year.  to 10.1 million tonnes in 2017-18. Although, the increase in 2018-19 is expected to slow down amounting only
 access to 58 items, shared by Pakistan besides   to 10.2 million tonnes. By the end of the coming season, warehouses outside of China are expected to house
 providing concession on all items included in the   Furthermore, to increase trade and competitiveness,   about 61pc of the world’s global reserves.
 offer list. Also, signing the FTA with Thailand will   Pakistan also wants to begin negotiation with South
 provide Pakistan with benefits worth $200 million and   East Asian and Pacific nations on preferential trade   China’s ending stocks indicate increased use of mills and which will result in increased imports and the 2018-19
 enhance the trade volume between the two nations.  agreement that lead to FTA. Countries on the list of   growing global demand might head towards increased prices during a possible global production decrease.
 FTA include Japan, Vietnam, Indonesia
 Pakistan and Thailand final list of FTA negotiation will   and Philippines.


 Garments worth US$211.213 million


 exported in July 2018  India’s cotton output likely to


 During the first month of current fiscal year, readymade garments worth US$ 211.213 million has been   decline by 3-4 pc
 exported as compared to the same period last year of exports worth US$ 212.199 million.

 In July 2018, approximately 3,648 thousand dozen of readymade garments exported as compared the exports   Due to a decrease in rainfall, pink bollworm attack   the pink bollworm infestation. This is likely to affect
 of 3,102 thousand dozen of same period of last year. Whereas, knitwear worth of US$ 208.880 million exported   and decline in acreage, cotton production is   cotton production by 3-4 per cent this year to 350
 during the period under review as compared the exports of US$ 193.802 million of same month of last year   expected to decline by 3-4pc to about 350 lakh   lakh bales. Cotton has lost area in Andhra Pradesh,
 and about 9,195 thousand dozen of different knitwear exported during first month of current financial year as   bales. Gujrat is already facing a 7pc deficit of cotton   Maharashtra, Punjab and Karnataka to lucrative
 compared the 7,529 thousand dozen of same period last year.  production. During the season (Sep – Oct), the   crops like soybean. Farmers are finding soybean
              estimated cotton crop was 365 lakh bales. Overall, in   more lucrative and the increase in minimum support
 According to the Pakistan Bureau of Statistics, during the same period, Pakistan textile group exports were   India, till 27 August sowing stood at 116 lakh   price to  3,399 per quintal in 2018-19 from  3,050
 recorded at US$ 1.002 billion against exports worth US$ 1.008 billion of the same period preceding year and   hectares as compared to 124.50 lakh hectares   per quintal in 2017-18, is providing an
 textile products in July 2018 recorded an increase of 0.49pc.  sowing during the same period previous year.  additional incentive.”

 Meanwhile, exports of raw cotton has decreased by 8.71pc, bed wear by 3.85pc and cotton cloth by 9.94pc.   Mr Atul Ganatra, CAI president said, “Major cotton   Mr Ganatra further informed that out of 21 lakh
 The exports of other textile products which includes cotton yarn, yarn, knitwear and other textile materials has   growing States are facing issues, including deficit   cotton growing villages in Maharashtra, 7 lakh
 grown by 7.62pc, 73.74pc, 7.78pc and 3.24pc, respectively.  rainfall and shifting away from cotton to other crops,   villages cotton crop has been infected with
              resulting in a decline in acreage and the outbreak of   pink bollworm.
 The exports of towels grew by 0.51 percent during the period under review and it was recorded at 15,129
 metric tons valuing US$ 51.707 million as compared the exports of 13,456 metric tons worth of US$ 51.447
 million of same month of last year.

 August/September 2018                                                              August/September 2018

