


Page 75 - TEXtalks. August- September 2023
P. 75
75

                                     World merchandise trade volume, 2019Q1-2023Q1
                               (Volume index 2015 = 100 and year-on-year percentage change)
             115                                                                                   30


                                                                         Volume index, 2015=100
             110                                             22.1                                  20
           Volume index 2015=100  105  1.2  0.6  -0.1  -0.5  -3.4  1.7  6.6  7.2  5.6  4.1  3.4  5.7  0.3  10 Year-on-year percentage change (%)


             100
                                                                                                    0


               95                              -4.1                                          -1.0  -10
                                         -14.7


              90                                                                                   -20


               85                                                                                 -30
            Quarter  1  2    3   4    1    2    3   4    1    2   3    4    1   2    3    4   1
              Year       2019               2020              2021               2022        2023

              Year-on-year percentage change
              Source: WTO and UNCTAD.

             formulate responses to benefit the people they serve.   COVID-19 pandemic. Trade growth in 2022 was
             It provides useful insights for WTO members and all   accompanied by real GDP growth at market
             those involved in trade analysis.                exchange rates of 3.0%, down from 5.9% in 2021.

             World exports of intermediate goods (IGs) inputs   China remained the top merchandise exporter in
             used to produce a final product fell from a 9 percent   2022 but its share in world exports declined to 14%
             year-on-year increase in quarter 1 of 2022 to a 10   (from 15% in 2021). The United States (8% of world
             percent decline. In value terms, they remained stable   trade) and Germany (7%) were ranked in second and
             compared to 2021, amounting to US$ 9.7 trillion.   third positions.
             Weakness in the exchange of industrial inputs in
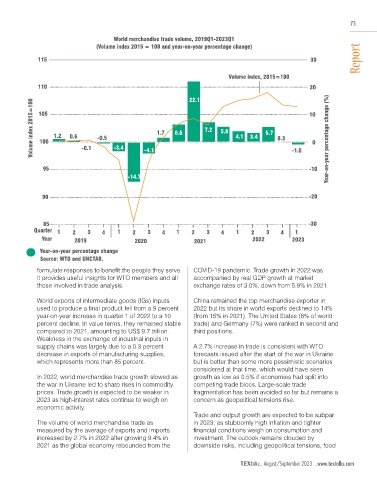
             supply chains was largely due to a 0.3 percent   A 2.7% increase in trade is consistent with WTO
             decrease in exports of manufacturing supplies,   forecasts issued after the start of the war in Ukraine
             which represents more than 85 percent.           but is better than some more pessimistic scenarios
                                                              considered at that time, which would have seen
             In 2022, world merchandise trade growth slowed as   growth as low as 0.5% if economies had split into
             the war in Ukraine led to sharp rises in commodity   competing trade blocs. Large-scale trade
             prices. Trade growth is expected to be weaker in   fragmentation has been avoided so far but remains a
             2023 as high-interest rates continue to weigh on   concern as geopolitical tensions rise.
             economic activity.
                                                              Trade and output growth are expected to be subpar
             The volume of world merchandise trade as         in 2023, as stubbornly high inflation and tighter
             measured by the average of exports and imports   financial conditions weigh on consumption and
             increased by 2.7% in 2022 after growing 9.4% in   investment. The outlook remains clouded by
             2021 as the global economy rebounded from the    downside risks, including geopolitical tensions, food


                                                                                    August/September 2023

